Read, filter and export a report
Click any report card in Dashboard → Statistics to open it. Every ready-made and custom report shares the same top bar so you can adjust dates, comparisons and filters without editing the report itself.
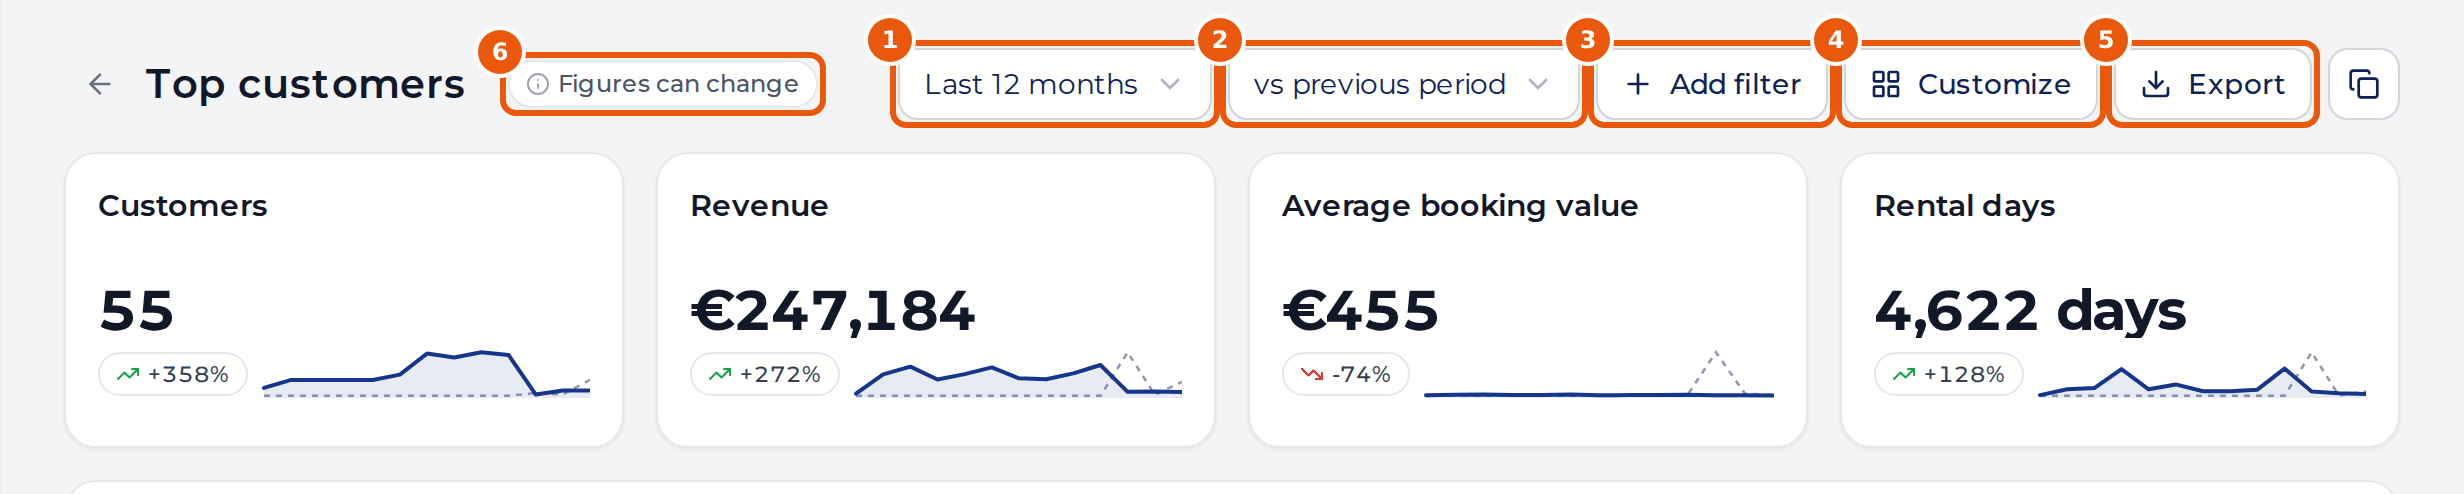
- Period — choose a preset or pick a custom date range.
- Comparison — compare against the previous period or previous year.
- Add filter — narrow every matching widget in the report at once.
- Customize — rearrange, edit or add widgets (saves as your own copy when customizing a ready-made report).
- Export — download the report as CSV, or download the per-payment ledger on payment reports.
- Figures can change — appears when the period includes active open-ended rentals whose totals or occupied days can still change until returned.
Choose a period
Open the Period menu to switch time frames:
- Past: Last 7 days, Last 30 days, Last 90 days, Last 12 months, Last month, Last year, All time.
- Current period: This month, This quarter, This year.
- Upcoming: Next 30 days, Next 90 days (useful for forward-looking reports such as On the books).
- Custom range: pick any inclusive start and end date on the calendars.
All report dates use your organization’s time zone. Your chosen period, comparison and filters stay in the page URL, so you can bookmark or share a filtered view with a teammate who has Statistics access.
Compare periods
Open the Comparison menu to choose:
- No comparison — show only the selected period.
- vs previous period — compare with the immediately preceding window of the same length (for example, the previous 30 days or the previous month).
- vs previous year — compare with the exact same dates one year earlier.
On forward-looking On the books widgets, vs previous year uses pace comparison: it counts only what was already booked at the same lead time one year ago, rather than final year-ago totals.
Number tiles show the change pill (green when the move is favorable for that metric, red when unfavorable) and a sparkline. Hover or focus a change pill, chart point or ranked list row to see the exact prior-period figure.
Filter the report
- Click Add filter in the header.
- Pick a dimension — for example Vehicle class, Vehicle, Customer, Channel, Status, Pickup location or Hire type.
- Choose is (include only selected values) or is not (exclude selected values) and pick one or more values.
- Click outside or apply. Active filters appear as removable chips below the header.
Report-level filters apply to every widget whose data source has that dimension, and are safely ignored by widgets on other data sources.
Click into the underlying records
Every number tile, chart bar, line point, donut slice, heatmap cell and table cell is interactive. Click any data point to open the Records drawer on the right showing the bookings, payments, vehicles, invoices, expenses or damages behind that exact figure.
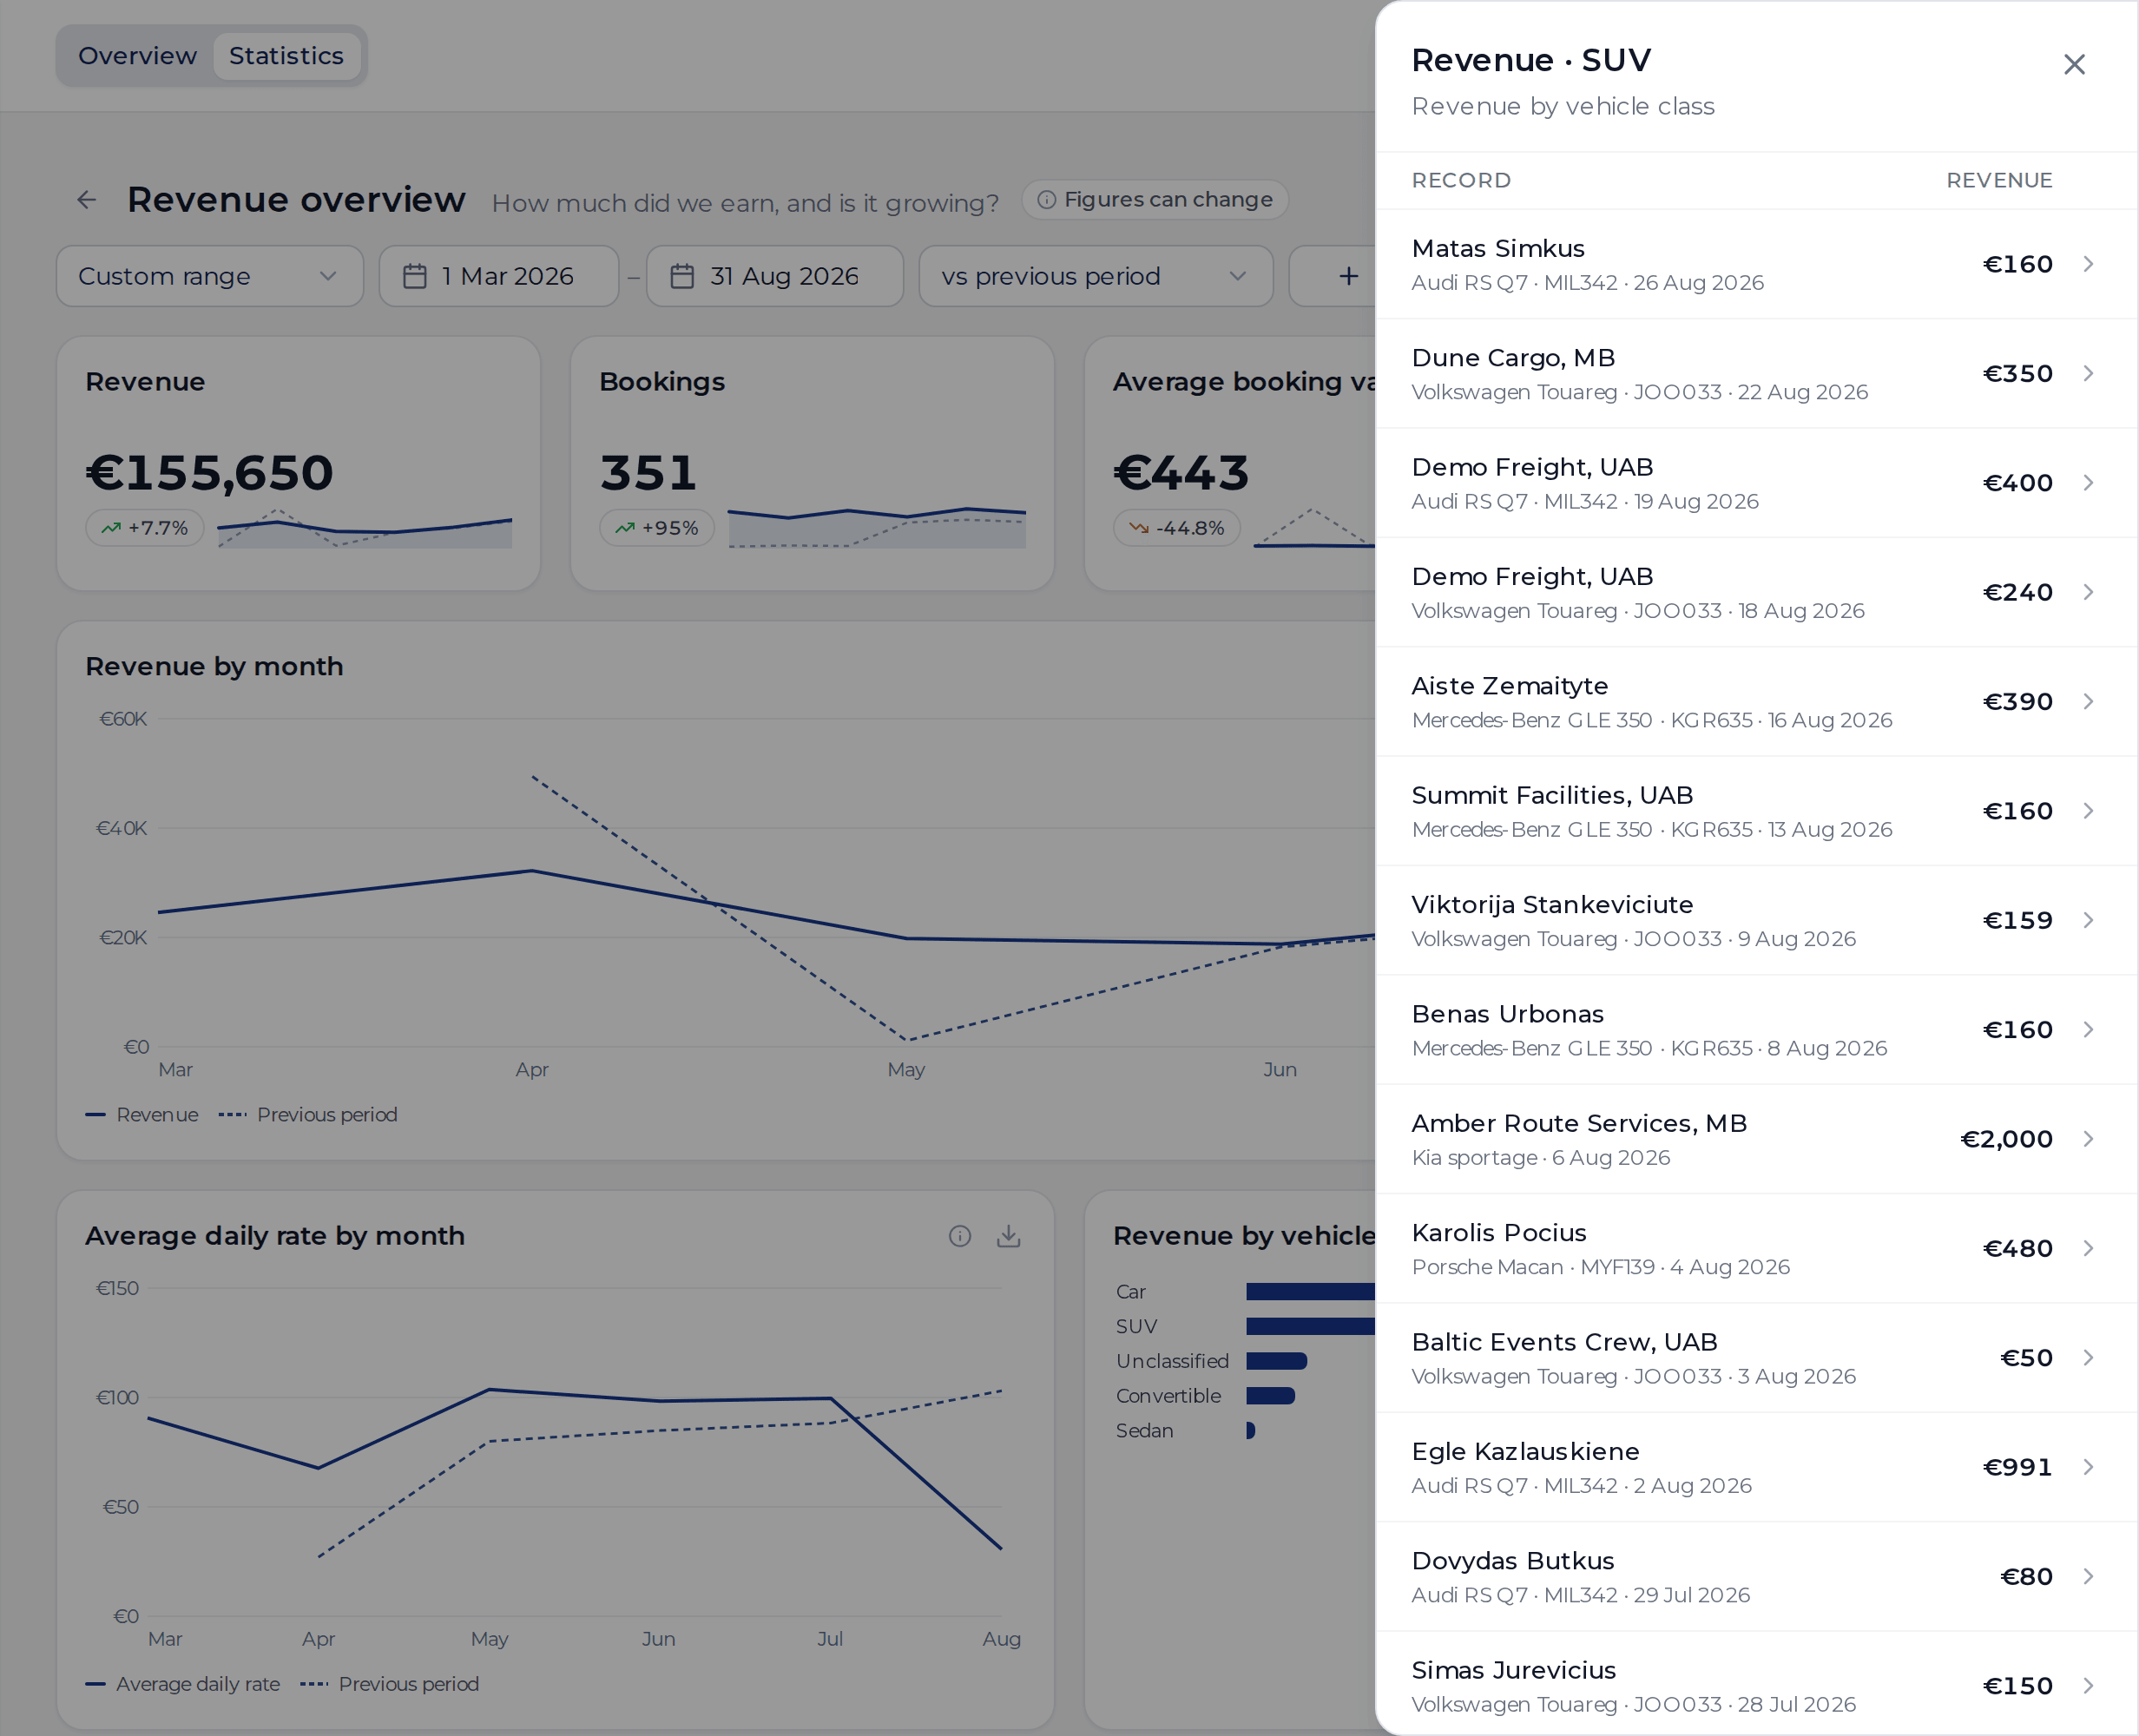
- Click any record row to open that booking, vehicle, customer, invoice or expense in a new view.
- In a table with multiple metric columns, clicking a specific metric cell drills into the records counted by that column (for example, clicking Open damages lists only open damages, while clicking Damages lists all damages).
- Clicking Other drills into the exact groups folded into the Other bucket.
- Up to 200 records load per drill-down, sorted newest first (or largest first for vehicle lists).
Export data
- Single widget CSV: click the download icon in the top-right corner of any widget card to export that widget’s table of numbers.
- Full report CSV: click Export in the report header (or Export → Report (CSV)) to download every widget’s numbers in one file, using the current period and filters.
- Payment list (Excel or CSV): on Payments received (and any custom report containing a payment-income widget), Export also offers Payment list (Excel) and Payment list (CSV).
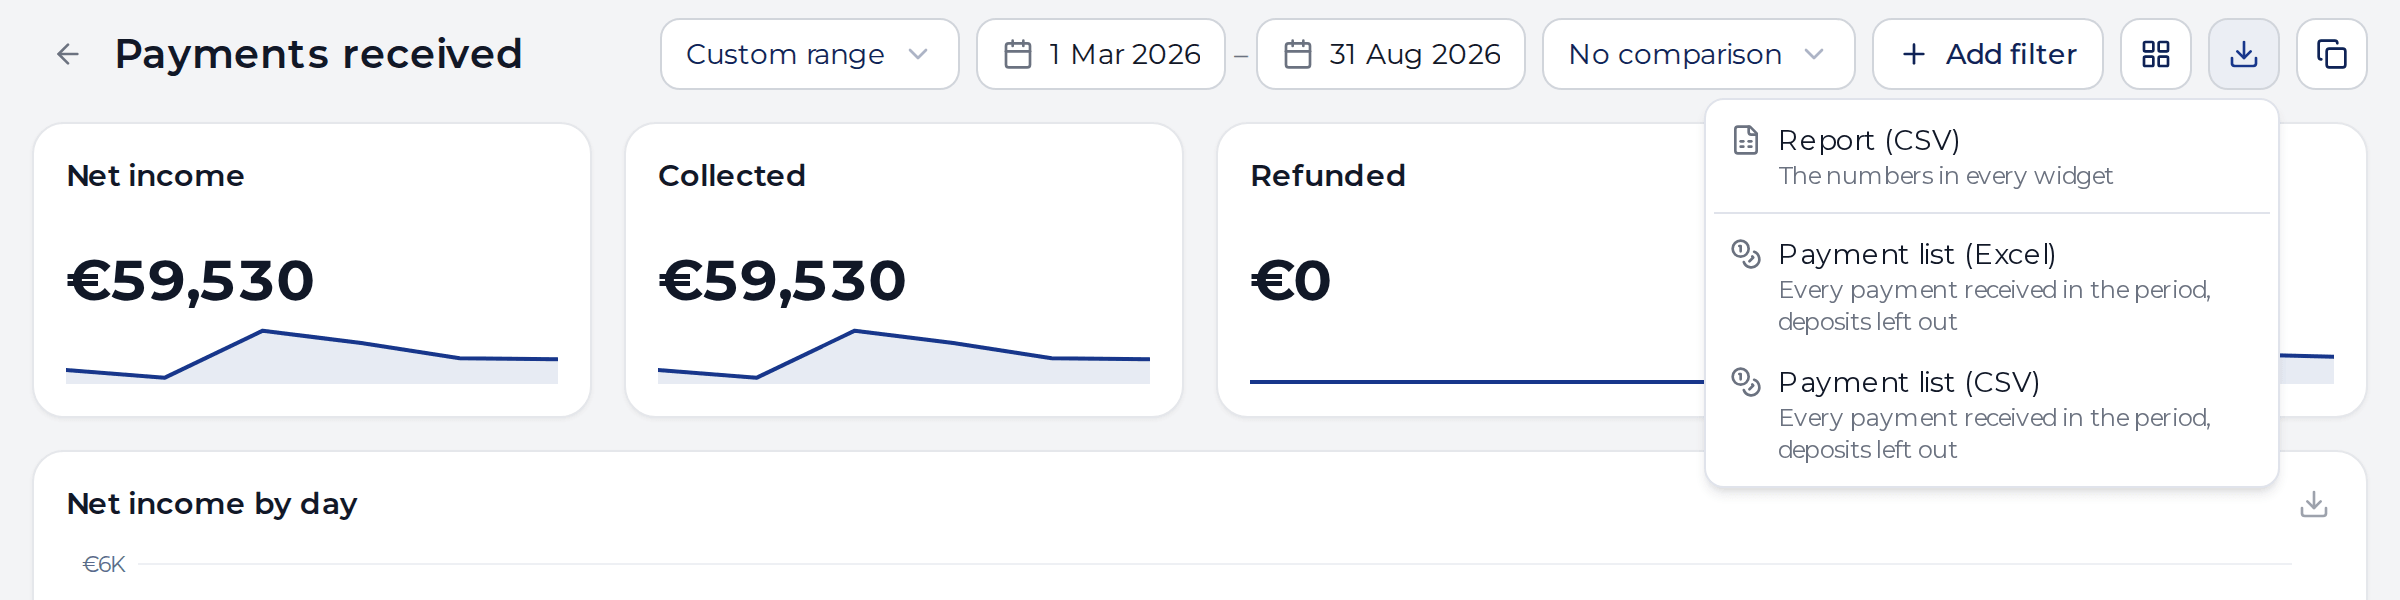
The payment list downloads one row per rental payment or refund in the report’s period (using your organization’s time zone), with deposits excluded so it matches the report’s Net income total. It supports filtering by up to one vehicle class; if other payment filters are active, remove them to enable the payment list export.