Create and customize reports
Build your own reports from scratch, or start from any ready-made report and adjust it to fit your operation.
Start a custom report
There are three ways to start:
- From scratch: in Dashboard → Statistics, click New report. Enter a report name and optional description in the header, then click Add widget.
- From a ready-made report: open any built-in report and click Customize (or the Duplicate icon). Changing a ready-made report saves a private copy under Your reports — the built-in original always stays intact.
- From an existing custom report: open it and click Customize to edit it, or open the ⋯ menu and click Duplicate to branch a new copy.
Add or edit a widget
In edit mode, click Add widget (or click the edit icon on an existing widget card) to open the widget editor. New widgets start with a gallery of quick templates, or you can choose Start from scratch.
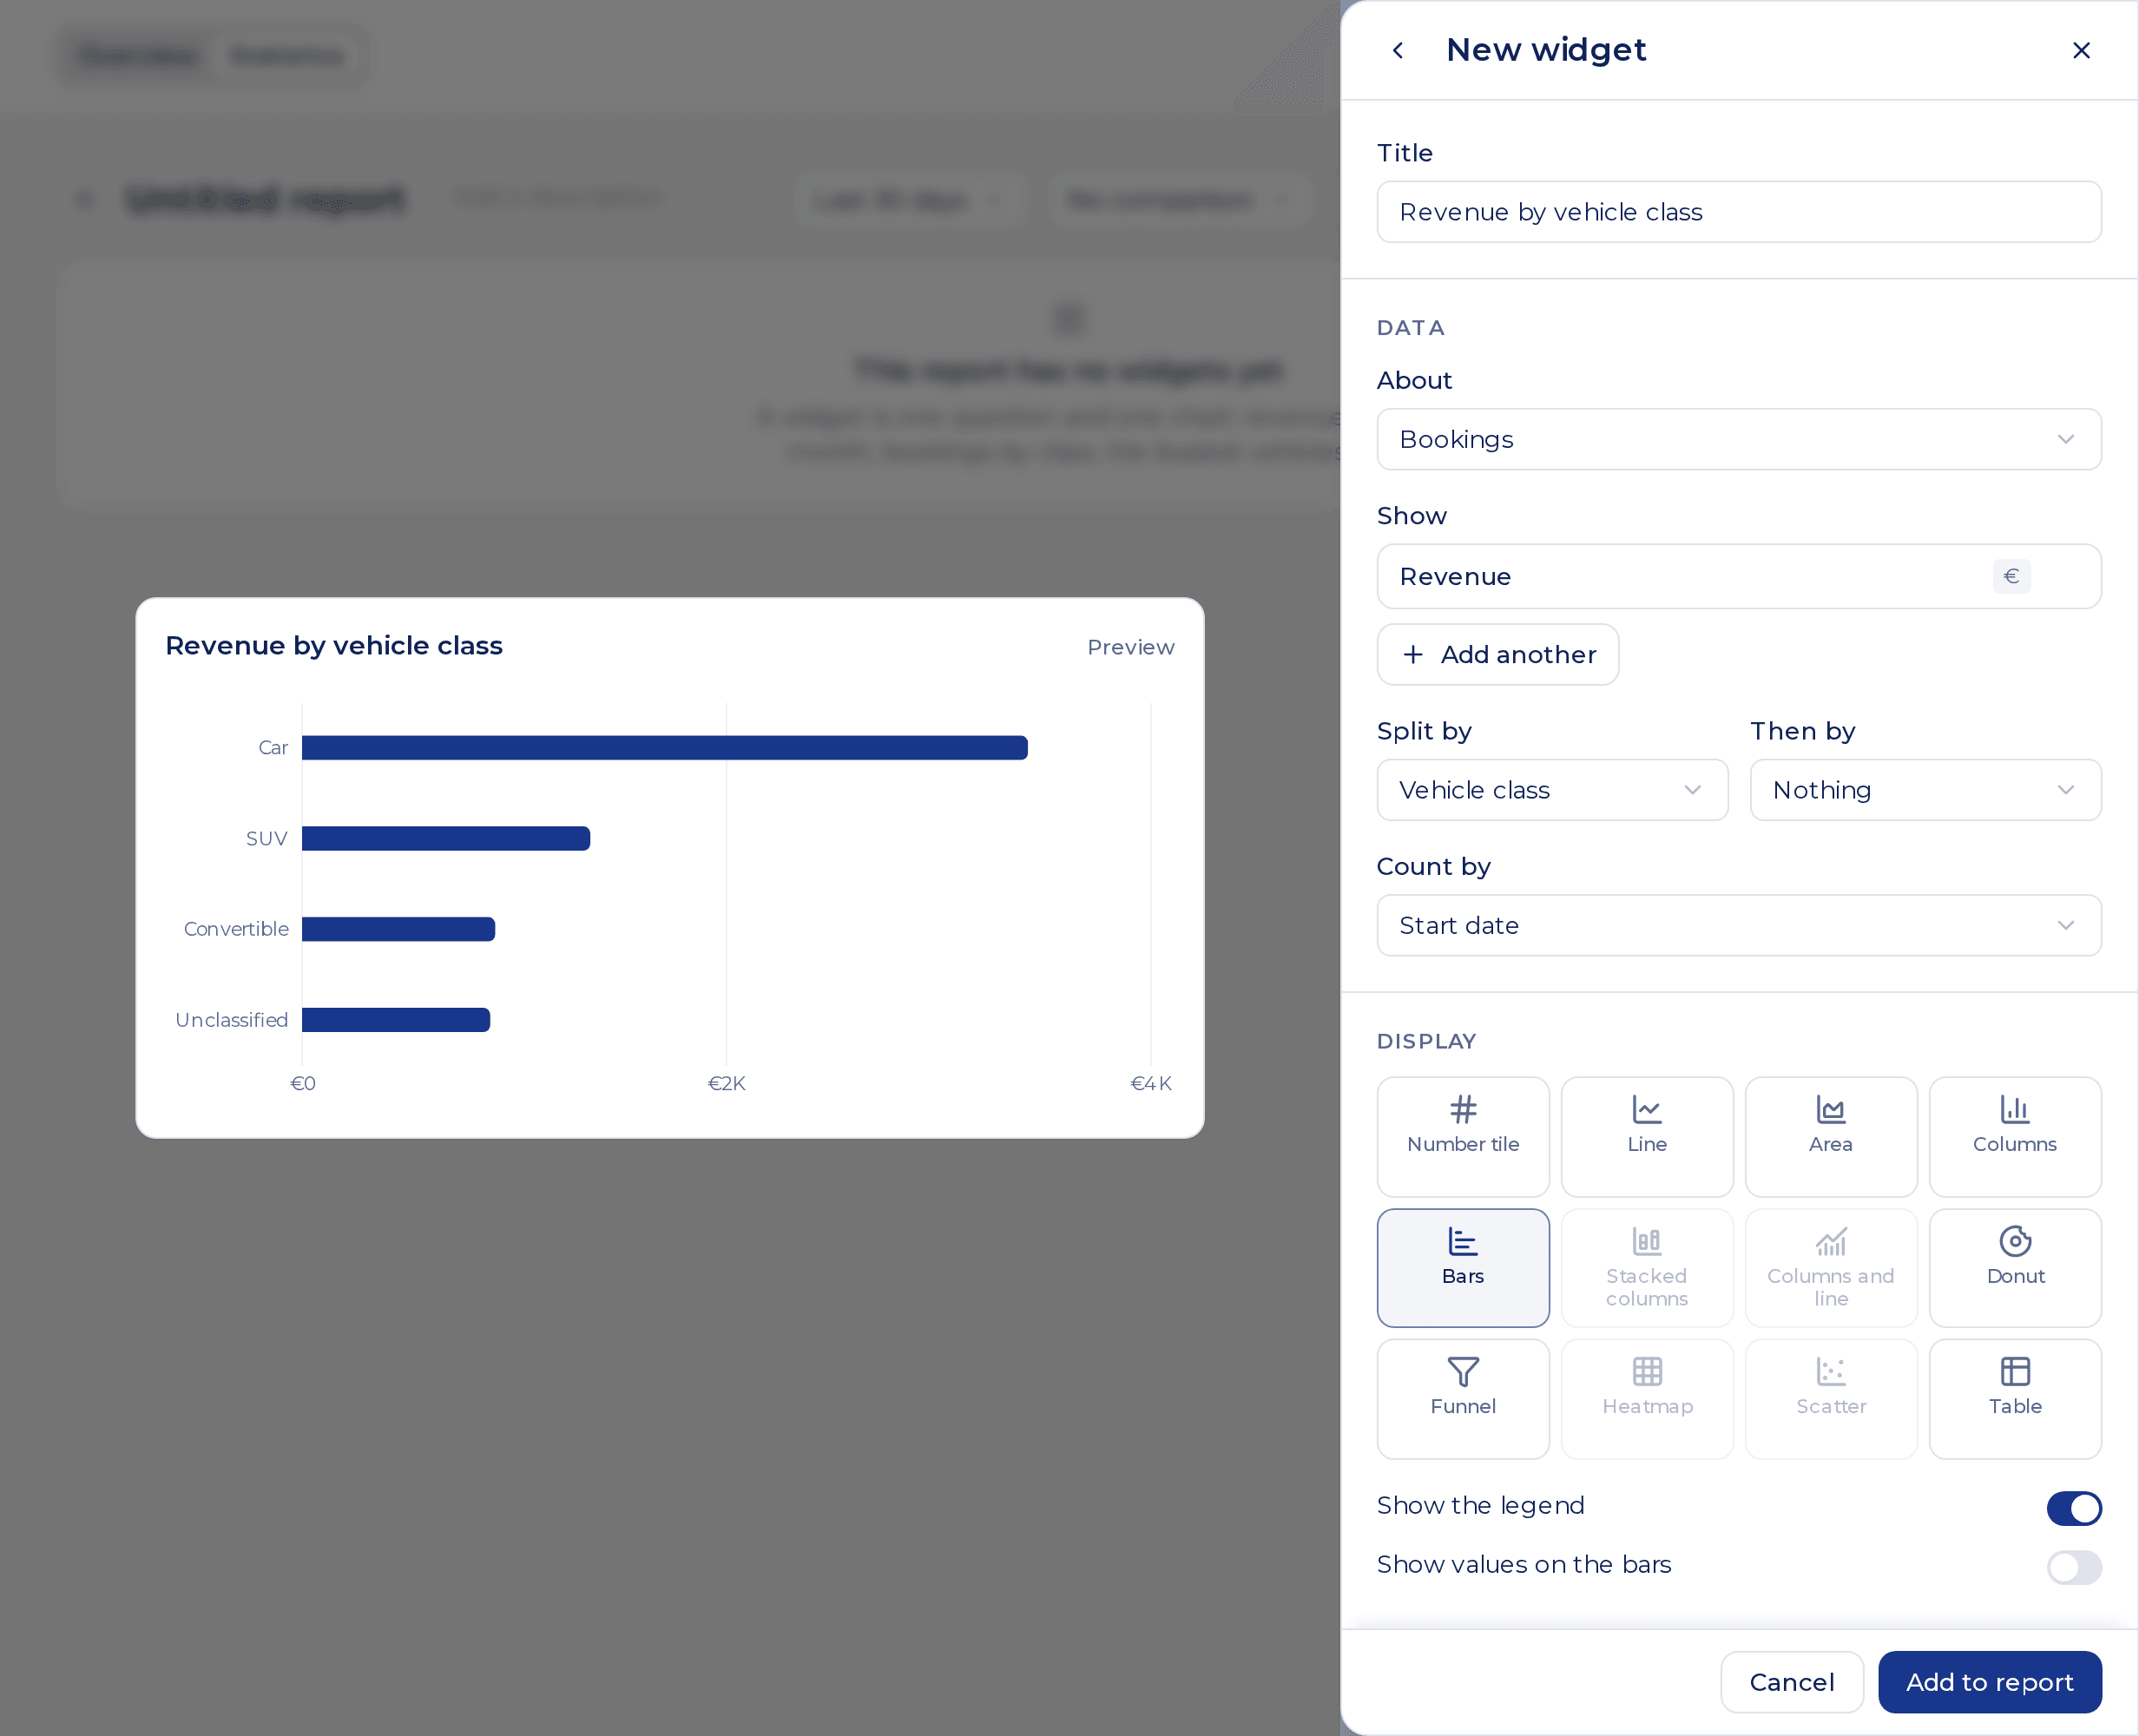
The live preview updates as you change settings:
1. Data
- About: pick one of the 9 data sources (Bookings, Fleet and utilization, Payments received, Costs, Invoices, Damages, Add-ons, Guest Book visits or Profit).
- Show: choose 1 to 4 metrics to measure (such as Revenue, Utilization, Average daily rate or Profit).
- Split by: group the data by Date or any dimension (such as Vehicle class, Vehicle, Customer, Channel or Day of week). When splitting by Date, you can choose the time step (Automatic, Day, Week, Month, Quarter or Year).
- Then by: optionally add a second dimension to break series down into stacked columns, multiple lines, a heatmap grid or multi-column tables.
- Count by: when a data source has multiple dates (for example Bookings has Start date, Date booked and Return date; Invoices has Invoice date, Due date and Date paid), pick which date puts records into the period.
2. Display
Choose from 12 visualizations:
| Visualization | Best for | Requirements |
|---|---|---|
| Number tile | Single KPI headline with comparison badge and optional trend sparkline | 1 metric |
| Line | Trends over time | Split by required (typically Date) |
| Area | Cumulative or volume trends over time | Split by required |
| Columns | Comparing categories or time buckets side by side | Split by required |
| Bars | Ranked horizontal lists (vehicles, classes, customers, reasons) | Split by required (non-date) |
| Stacked columns | Totals broken down by a second dimension (stacked or 100%) | Split by + Then by (or 2+ metrics) |
| Columns and line | Two metrics on separate scales (e.g. cancelled count + cancellation rate) | Split by + 2 metrics |
| Donut | Share of a whole across categories | Split by required (non-date), no Then by |
| Funnel | Step-by-step drop-off (e.g. Guest Book visit → checkout → booking) | Funnel stage dimension or 2+ ordered metrics |
| Heatmap | Two-dimensional intensity (e.g. pickups by weekday and hour) | Split by + Then by |
| Scatter | Comparing two metrics per item (e.g. utilization vs daily rate by car) | Split by + 2 metrics |
| Table | Multi-column detailed breakdowns with totals and per-cell drill-down | Any combination (up to 4 metrics) |
Any chart type that does not fit your current Data selection is dimmed with a tooltip explaining what to add or clear. Depending on the visualization, you can also toggle Show the legend, Show values on the bars, Show the comparison, choose Stacking (Overlap, Stacked or 100%), or enter a Target line value.
3. Filters, conditions and ranking
Each widget can narrow its own data independently of the report toolbar:
- Filters: click Add filter inside the widget editor to lock specific values (for example, show only
SUVbookings or exclude cancelled ones). - Only rows where (conditions): click Add condition to filter grouped rows by metric value — is more than, is at least, is less than or is at most (for example, show only vehicles with at least 5 bookings, or customers owing more than €100). Up to 4 conditions per widget.
- Sort: keep the Usual order, sort by any metric (highest first / lowest first), or sort by the dimension (in order / reversed).
- How many & Other: limit categorical widgets to Top 5, 10, 15, 20, 25 or 50, and optionally toggle Group the rest as Other so remaining items still add up to the full total.
4. Period and size
- Period: keep The report’s period (follows the report toolbar) or pick A fixed period (always shows e.g. Last 30 days or All time regardless of the toolbar).
- Size: pick the widget’s width and height on the 4-column grid, or resize it directly on the canvas.
Click Add to report (or Apply) when done. A report can hold up to 24 widgets.
Arrange the layout and save
While in edit mode:
- Move: drag any widget card by its handle to reposition it on the 4-column grid.
- Resize: drag the bottom-right corner of a widget card to widen or heighten it.
- Duplicate or remove: use the card’s action icons to duplicate a widget as a starting point or remove it.
- Save or Discard: click Save in the sticky top bar to store your changes, or Discard to revert to the last saved version.
The current report toolbar period, comparison and filters are saved as the report’s defaults when you save a new report.
Share, rename or delete a custom report
Open a custom report and click the ⋯ menu in the top-right corner:
- Duplicate — create a private copy you can modify freely.
- Share with team — make the report visible under Your reports to everyone in your organization who has Statistics access.
- Make private — restrict a shared report back to Only you.
- Rename — update the report’s title and description.
- Delete — permanently remove the custom report.
Ready-made reports cannot be deleted or overwritten; customizing one always saves to your own copy.