Statistics and reports
Open Dashboard → Statistics to review your fleet’s revenue, utilization, bookings, customers, payments, costs, operations and Guest Book performance.
The report library brings together 31 ready-made reports and any custom reports you or your team create.
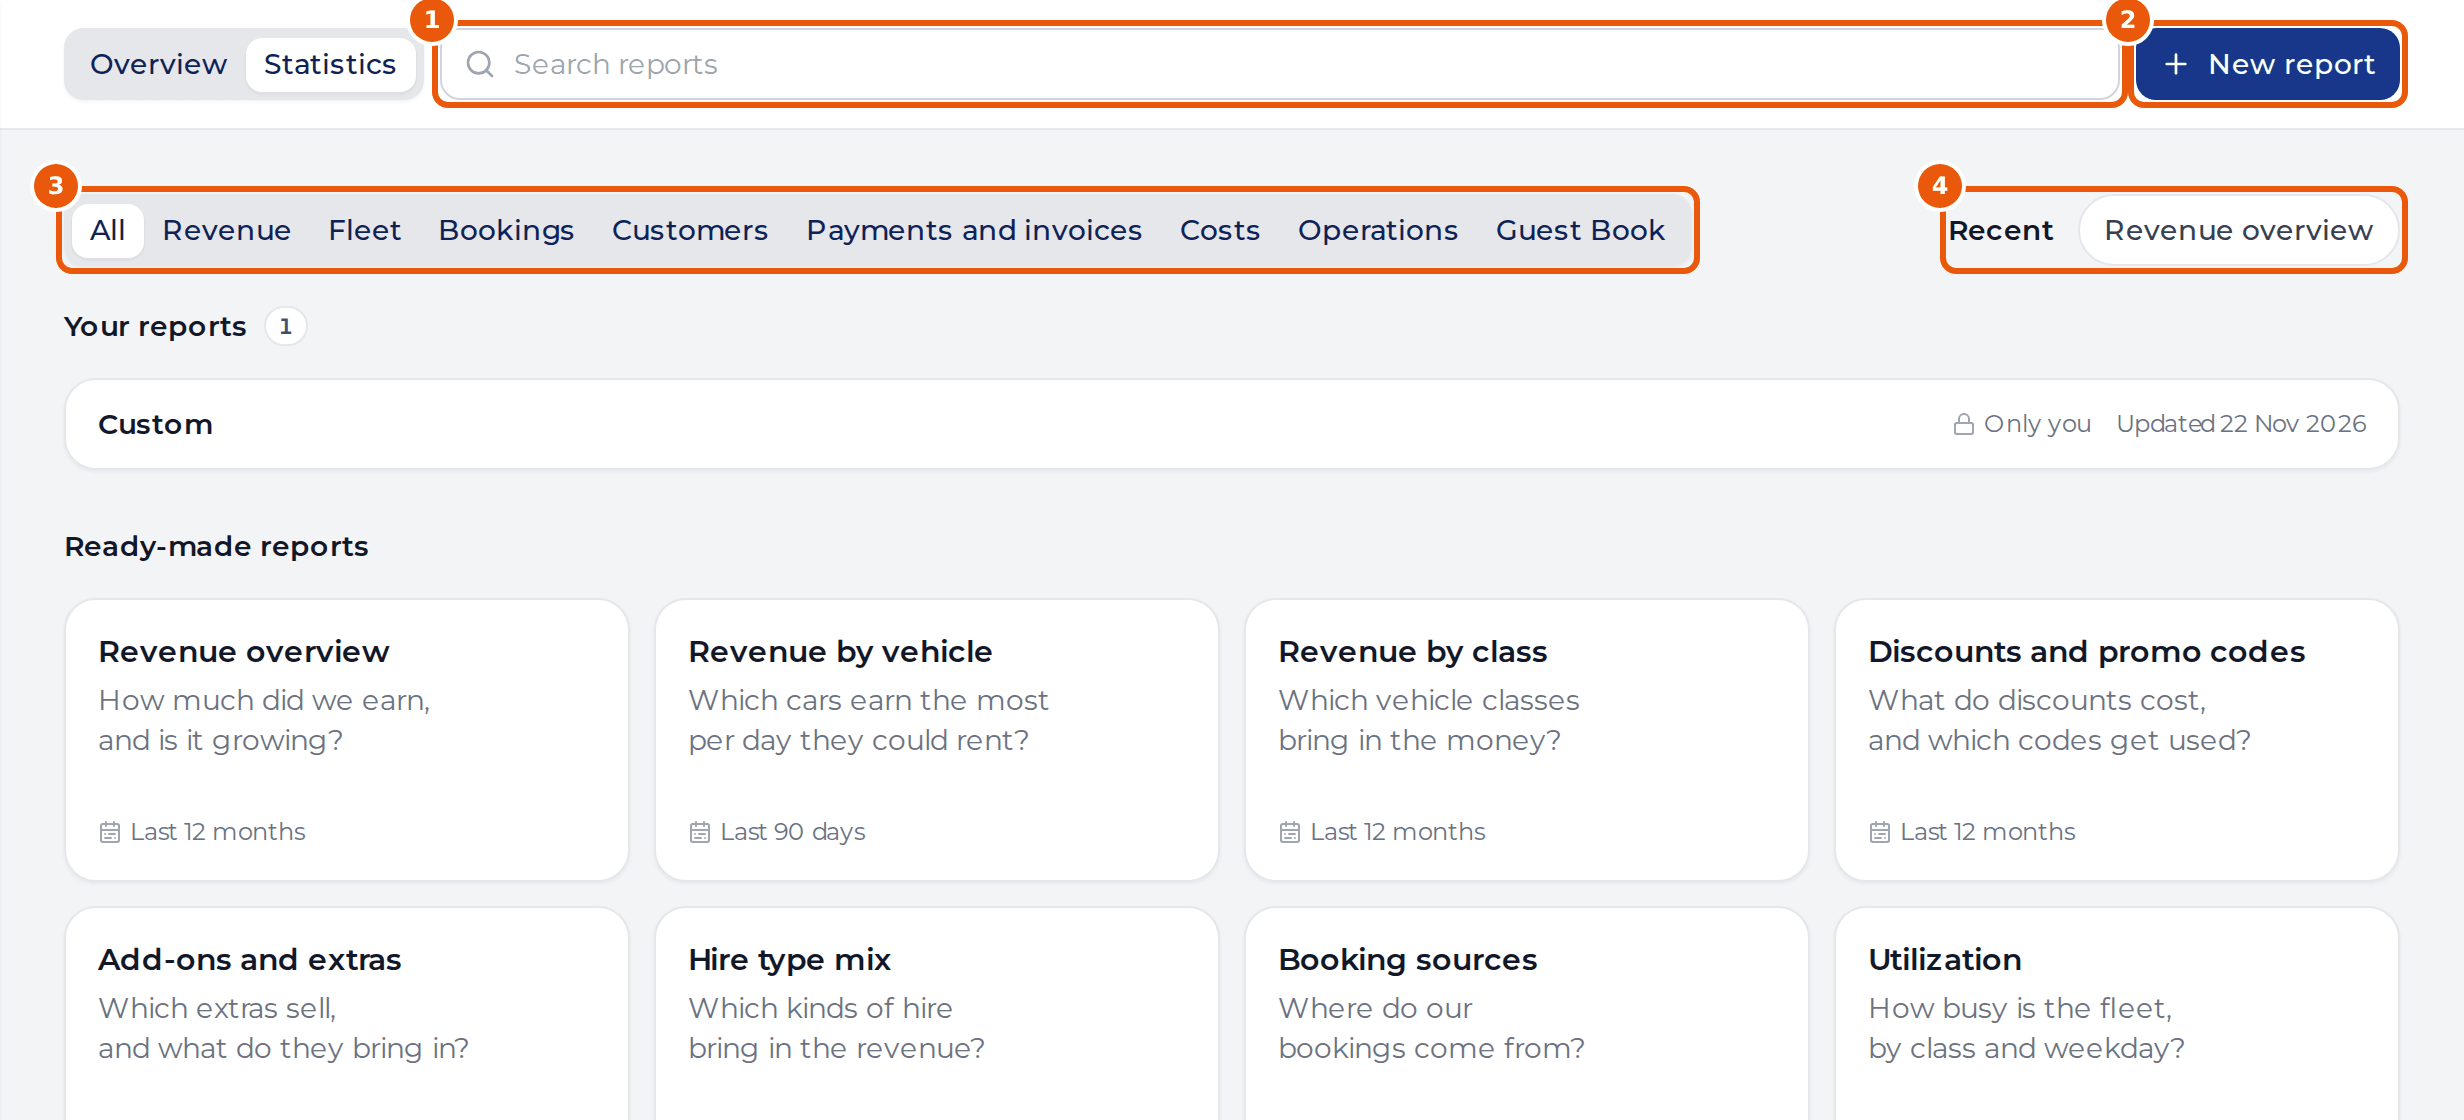
- Search reports — filter the library by report name or description.
- New report — create a blank custom report on a drag-and-drop grid.
- Area tabs — switch between All and eight focus areas: Revenue, Fleet, Bookings, Customers, Payments and invoices, Costs, Operations and Guest Book.
- Recent — jump straight back to reports you opened recently.
Your saved reports appear under Your reports above Ready-made reports. Each saved report shows whether it is Only you (private) or Shared with the team.
Who can open Statistics
Access to Dashboard → Statistics follows your organization’s finance permission (Admin, Admin viewer, or a team member granted Finances manage access).
- View-only roles (such as Admin viewer) can open every ready-made and shared report, change periods and filters, inspect underlying records and export files, but cannot create, edit, share or delete custom reports.
- See Roles and permissions for role details.
Where to go next
- Read, filter and export a report — pick time frames, compare periods, apply filters, drill into records and export CSV or Excel files.
- Create and customize reports — build custom layouts, pick from 12 visualizations, add widget conditions and share with your team.
- Ready-made reports — the complete list of all 31 built-in reports and what each one answers.
- Data sources and metrics — how each dataset, date field and metric is calculated.
Last updated on